Introduction
After running an OpenShift or Kubernetes cluster for a little while you find that you need to create reports on specific data about the cluster itself. Reporting on things like Project owners, container images in use, and project quota are just some of the things you might be asked about. There are multiple ways to do this, such as writing your own application that queries the API, or creating a shell script that wraps a bunch of cli commands. For very complex reports, these tactics may be required. For simpler requests, there is another way, using the provided command line client such as “oc” or “kubectl” and a built-in feature which allows you to specify the output format for your query.
Before We Begin
If you want to try these commands out yourself, you will need a working Kubernetes or OpenShift cluster to connect to. If you want to stand up your own cluster, see some of my previous posts on creating your very own cluster such as OpenShift on Azure. In the remainder of this post I will be referring to the “oc” command and “OpenShift”, however what I outline here will work with a regular Kubernetes cluster as well. All you need to do is replace the “oc” command with the “kubectl” command. If you have a Kubernetes cluster and the kubectl command you can run the command with the same options, just substitute “kubectl” for “oc” in the following examples.
Starting with a purpose in mind
In order to demonstrate this process, we will start with a task in mind. We will use a similar scenario to what go me to look into this. Imagine we need to review 100s of OpenShift Routes across many Namespaces to find which routes are using HTTPS and which routes have Whitelists enabled. Whitelists in OpenShift are a way to restrict access to a route to a specific set of defined IP addresses. This can be done by specifying one or many IP addresses as an annotation on a route. This is a special feature of routes, so it is not normally printed when you run an “oc get route”. Additionally, we will format the output as CSV so that it can easily be imported into a spreadsheet for others to consume.
NOTE: If you are a Kubernetes user, Routes are similar to Ingress controllers. They are a way of getting traffic into your cluster to a specific service.
Listing out the Routes
To understand how we are going to create this report, we need to start with knowing what just one “route” looks like. Using the “oc” client, connect to your cluster as a “cluster admin” and let’s see what routes are defined in your cluster. Run the command oc get route --all-namespaces. This will list out all the routes across the entire cluster:
$ oc get route --all-namespaces
NAMESPACE                          NAME                HOST/PORT                                                      PATH      SERVICES            PORT      TERMINATION          WILDCARD
default                            docker-registry     docker-registry-default.apps.okd.example.net                               docker-registry     <all>     passthrough          None
default                            registry-console    registry-console-default.apps.okd.example.net                              registry-console    <all>     passthrough          None
kube-service-catalog               apiserver           apiserver-kube-service-catalog.apps.okd.example.net                        apiserver           secure    passthrough          None
openshift-ansible-service-broker   asb-1338            asb-1338-openshift-ansible-service-broker.apps.okd.example.net             asb                 1338      reencrypt            None
openshift-console                  console             console.apps.okd.example.net                                               console             https     reencrypt/Redirect   None
openshift-monitoring               alertmanager-main   alertmanager-main-openshift-monitoring.apps.okd.example.net                alertmanager-main   web       reencrypt            None
openshift-monitoring               grafana             grafana-openshift-monitoring.apps.okd.example.net                          grafana             https     reencrypt            None
openshift-monitoring               prometheus-k8s      prometheus-k8s-openshift-monitoring.apps.okd.example.net                   prometheus-k8s      web       reencrypt            None
Reviewing the output from above you can see we have multiple routes defined in this cluster. Let’s examine one more closely. We will output the data in YAML format using the “-o yaml” option oc get route grafana -namespace openshift-monitoring -o yaml:
$ oc get route grafana -namespace openshift-monitoring -o yaml
apiVersion: route.openshift.io/v1
kind: Route
metadata:
  annotations:
    openshift.io/host.generated: "true"
    haproxy.router.openshift.io/ip_whitelist: "192.168.5.1"
  name: grafana
  namespace: openshift-monitoring
spec:
  host: grafana-openshift-monitoring.apps.okd.example.net
  port:
    targetPort: https
  tls:
    termination: reencrypt
  to:
    kind: Service
    name: grafana
    weight: 100
  wildcardPolicy: None
status:
  ingress:
  - conditions:
      type: Admitted
    host: grafana-openshift-monitoring.apps.okd.example.net
    routerName: router
    wildcardPolicy: None
If you have not seen YAML before it is standard configuration language that uses whitespace to create a hierarchical layout of information. We don’t need to understand all of the output above, we just need to center in on the information that we are most interested in. In this case, the “namespace”, the “name”, the “host”, if tls is enabled and if there is a whitelist defined. Using the above output as a guideline, let’s start to work on a report across the entire cluster.
Go Templating for Output
We are going to leverage the “go-template” output type which will allow us to specify the specific fields we are interested in and the exact format we want to output. Go Templates are a feature of the Go programming language. Don’t worry though, you don’t need to know the go programming language to use them. We will start simple, and print out a header, and two fields: “name” and “namespace”.
oc get routes --all-namespaces -o=go-template='{{"namespace,name\n"}}{{range .items}}{{.metadata.namespace}}{{","}}{{.metadata.name}}{{"\n"}}{{end}}
The output will look similar to this:
namespace,name
default,docker-registry
default,registry-console
kube-service-catalog,apiserver
openshift-ansible-service-broker,asb-1338
openshift-console,console
openshift-monitoring,alertmanager-main
openshift-monitoring,grafana
openshift-monitoring,prometheus-k8s
Let’s break down the command we just used. The first portion oc get routes --all-namespaces does just what it says and will (as previously seen) retrieve all the routes defined within this cluster across all namespaces. The real magic happens here -o=go-template='{{range...}}' so we will break this down into smaller chunks.
First, you will notice lots of curly-braces (ie. {{}}). These delineate individual actions to the Go template language. Next, anything inside the curly-braces and also in quotes will be printed out directly. This is how we get our header of “namespace,name”. Finally, “\n” is a symbol for “new line”. If we didn’t put that in there the output would be all strung together in one very long line, which would be very hard to read.
Moving on to the next section, we have {{range .items}}…{{end}}, which tells the template system to repeat over all the items that are returned and run the actions between the start and the final {{end}}. We then specify the items that we want the template to print out. If you compare the name “.metadata.namespace” to the YAML example above you can see that we are defining the path to the value you want, separating each level with a “.” We insert a comma between each field so that we end up with a “CSV” format by putting {{","}} between each field we are outputting.
Let’s add in the remaining fields (except whitelist for now) and see what we get:
oc get routes --all-namespaces -o=go-template='{{"namespace,name,hostname,tls\n"}}{{range .items}}{{.metadata.namespace}}{{","}}{{.metadata.name}}{{","}}{{.spec.host}}{{","}}{{.spec.tls.termination}}{{"\n"}}{{end}}
The output will look like so:
namespace,name,hostname,tls
docker-registry,docker-registry-default.apps.okd.example.net,passthrough
registry-console,registry-console-default.apps.okd.example.net,passthrough
apiserver,apiserver-kube-service-catalog.apps.okd.example.net,passthrough
asb-1338,asb-1338-openshift-ansible-service-broker.apps.okd.example.net,reencrypt
console,console.apps.okd.example.net,reencrypt
alertmanager-main,alertmanager-main-openshift-monitoring.apps.okd.example.net,reencrypt
grafana,grafana-openshift-monitoring.apps.okd.example.net,reencrypt
prometheus-k8s,prometheus-k8s-openshift-monitoring.apps.okd.example.net,reencrypt
With all of this command on one line, it can be difficult to read. Below is a multi-line pseudo-code version of the template which may be easier to read:
{{"namespace,name,hostname,tls\n"}}  # output our header
{{range .items}}  # loop over all the items
    {{.metadata.namespace}}{{","}} # print out the namespace this route is in
    {{.metadata.name}}{{","}} # print out the name of this route
    {{.spec.host}}{{","}} # print out the route hostname
    {{.spec.tls.termination}}{{"\n"}} # print out if the route has tls enabled
    {{"\n"}} # start a new line
{{end}}
Taking it up a notch
If you remember my original goal was to get not only the namespace, name, hostname and if tls was in use but also a lesser-known attribute called “WhiteList” and see if it was available. A whitelist shows up as an Annotation on the route with a key of “haproxy.router.openshift.io./ip_whitelist”. We want to output this as the last field on our line. Unfortunately its not as simple as just adding “{{.metadata.annotations.haproxy.router.openshift.io/ip_whitelist}}” and calling it a day. Annotations are a map (or array) of multiple fields. In order to get just the whitelist we will need to parse the annotations looking for the specific value we want. We can do this by creating a small “if” statement and then using the “index” operator to output all the values of the “haproxy.router.openshift.io/ip_whitelist” field.
oc get routes --all-namespaces -o=go-template='{{"namespace,name,hostname,tls,whitelist\n"}}{{range .items}}{{.metadata.namespace}}{{","}}{{.metadata.name}}{{","}}{{.spec.host}}{{","}}{{.spec.tls.termination}}{{","}}{{if .metadata.annotations}}{{index .metadata.annotations "haproxy.router.openshift.io/ip_whitelist"}}{{else}}{{"nil"}}{{end}}{{","}}{{"\n"}}{{end}}'
As before, all on one line, this is very hard to read and understand so let’s show exactly what this looks like in a pseudo-code layout:
{{"namespace,name,hostname,tls,whitelist,\n"}}  # output our header
{{range .items}}  # loop over all the items
    {{.metadata.namespace}}{{","}} # print out the namespace this route is in
    {{.metadata.name}}{{","}} # print out the name of this route
    {{.spec.host}}{{","}} # print out the route hostname
    {{.spec.tls.termination}}{{"\n"}} # print out if the route has tls enabled
    {{if .metadata.annotations }} # if there are annotations
        {{index .metadata.annotations "haproxy.router.openshift.io/ip_whitelist"}} # list out all the entries for ip_whitelist
    {{end}}{{","}} # end our if statement
    {{"\n"}} # start a new line
{{end}}
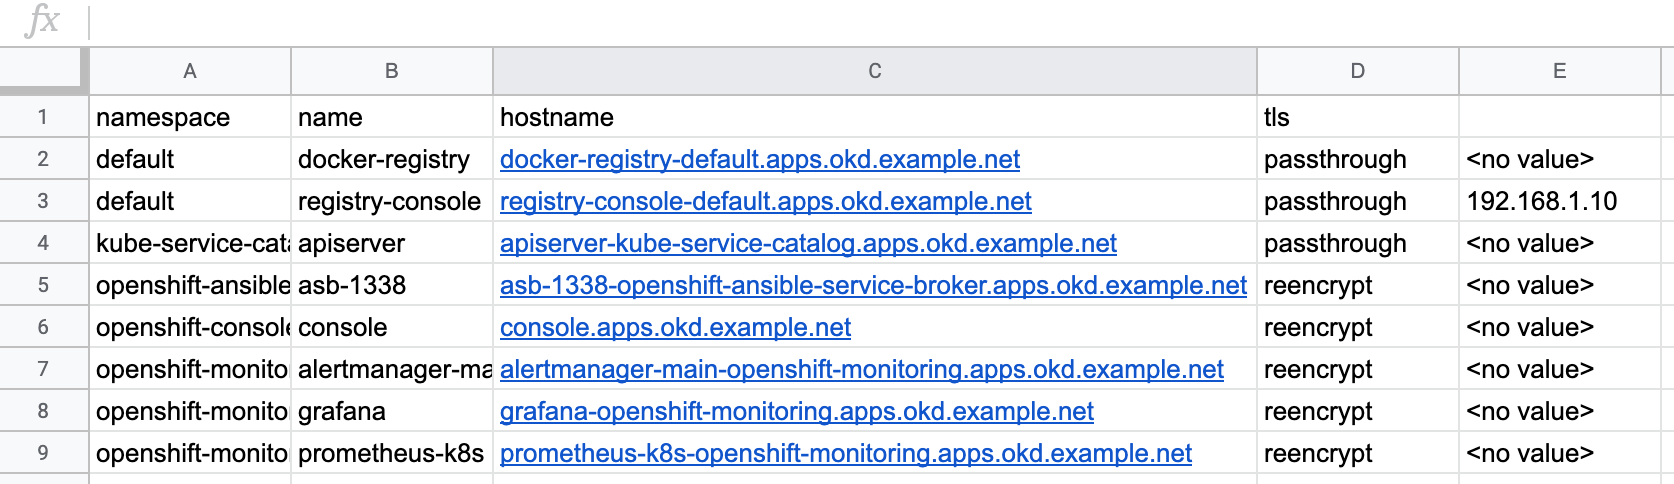
The output from this command is now what we set out to get:
namespace,name,hostname,tls,whitelist,
default,docker-registry,docker-registry-default.apps.okd.example.net,passthrough,<no value>,
default,registry-console,registry-console-default.apps.okd.example.net,passthrough,192.168.1.10,
kube-service-catalog,apiserver,apiserver-kube-service-catalog.apps.okd.example.net,passthrough,<no value>,
openshift-ansible-service-broker,asb-1338,asb-1338-openshift-ansible-service-broker.apps.okd.example.net,reencrypt,<no value>,
openshift-console,console,console.apps.okd.example.net,reencrypt,<no value>,
openshift-monitoring,alertmanager-main,alertmanager-main-openshift-monitoring.apps.okd.example.net,reencrypt,<no value>,
openshift-monitoring,grafana,grafana-openshift-monitoring.apps.okd.example.net,reencrypt,<no value>,
openshift-monitoring,prometheus-k8s,prometheus-k8s-openshift-monitoring.apps.okd.example.net,reencrypt,<no value>,
We can now take this output and import it into a spreadsheet application and share it with others. As an example, here is the CSV above opened in Google Sheets:
Conclusion
The go-template system allows for much more than we have seen above. For example, the if statement can be used to compare values and only print things out when they match something you are looking for. If you want to learn more about using the go-template output format or the other options such as jsonpath check out the following links: